Resharper 3.1 Solution Wide Analysis
Since early last year, I have been using Resharper to increase my .NET coding productivity. After seeing the product used at a Code Camp, I was intrigued by how it make test driven development so much easier. I started on version 3.0 and JetBrains dropped 3.1 on Christmas Eve so I checked it out over the holiday break.
One of the features that first interested me was the Solution Wide Analysis. I turned it on, looked at the badly drawn green circle in the corner of the Visual Studio 2005 IDE, and went, OK. It took me a bit more time to recognize how this new feature was going to improve my skills yet again.
The first thing I learned was that the blinking light was not the real power behind solution wide analysis. The power was that Resharper was working hard eating up those idle CPU cycles to verify the integrity of my entire solution. It wasn’t until I double clicked and put the window as part of my IDE into practice that I saw the true power (of the force?).
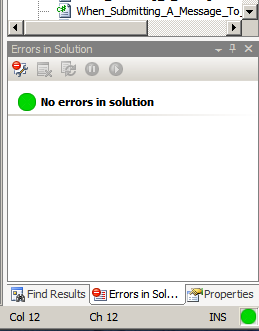
The above image shows the errors in solution window with a clean bill of health, no problems with compilation. The next image shows what it looks like when things get broken:
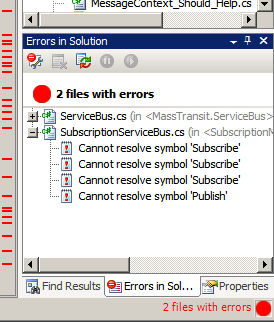
I slipped the window right under my solution explorer, giving me a constant view of my code status. When refactoring, it makes it easy to see all the affected files at a glance. Very cool. But I do have a couple of nags on this feature:
-
I really don’t need a tall bar eating space at the top of the window for a repeat of the red/green indicator – get rid of it
-
I would like the option to expand all the nodes in the tree by default instead of only showing the file names
The new solution wide analysis feature is a great red/green indicator to see the impact of code changes. If you haven’t upgraded to 3.1 yet, what are you waiting for? And if you aren’t using Resharper yet, what is holding you back?